Art + Neuroscience = Laurie Frick
/By Jesc Bunyard in Rooms Magazine
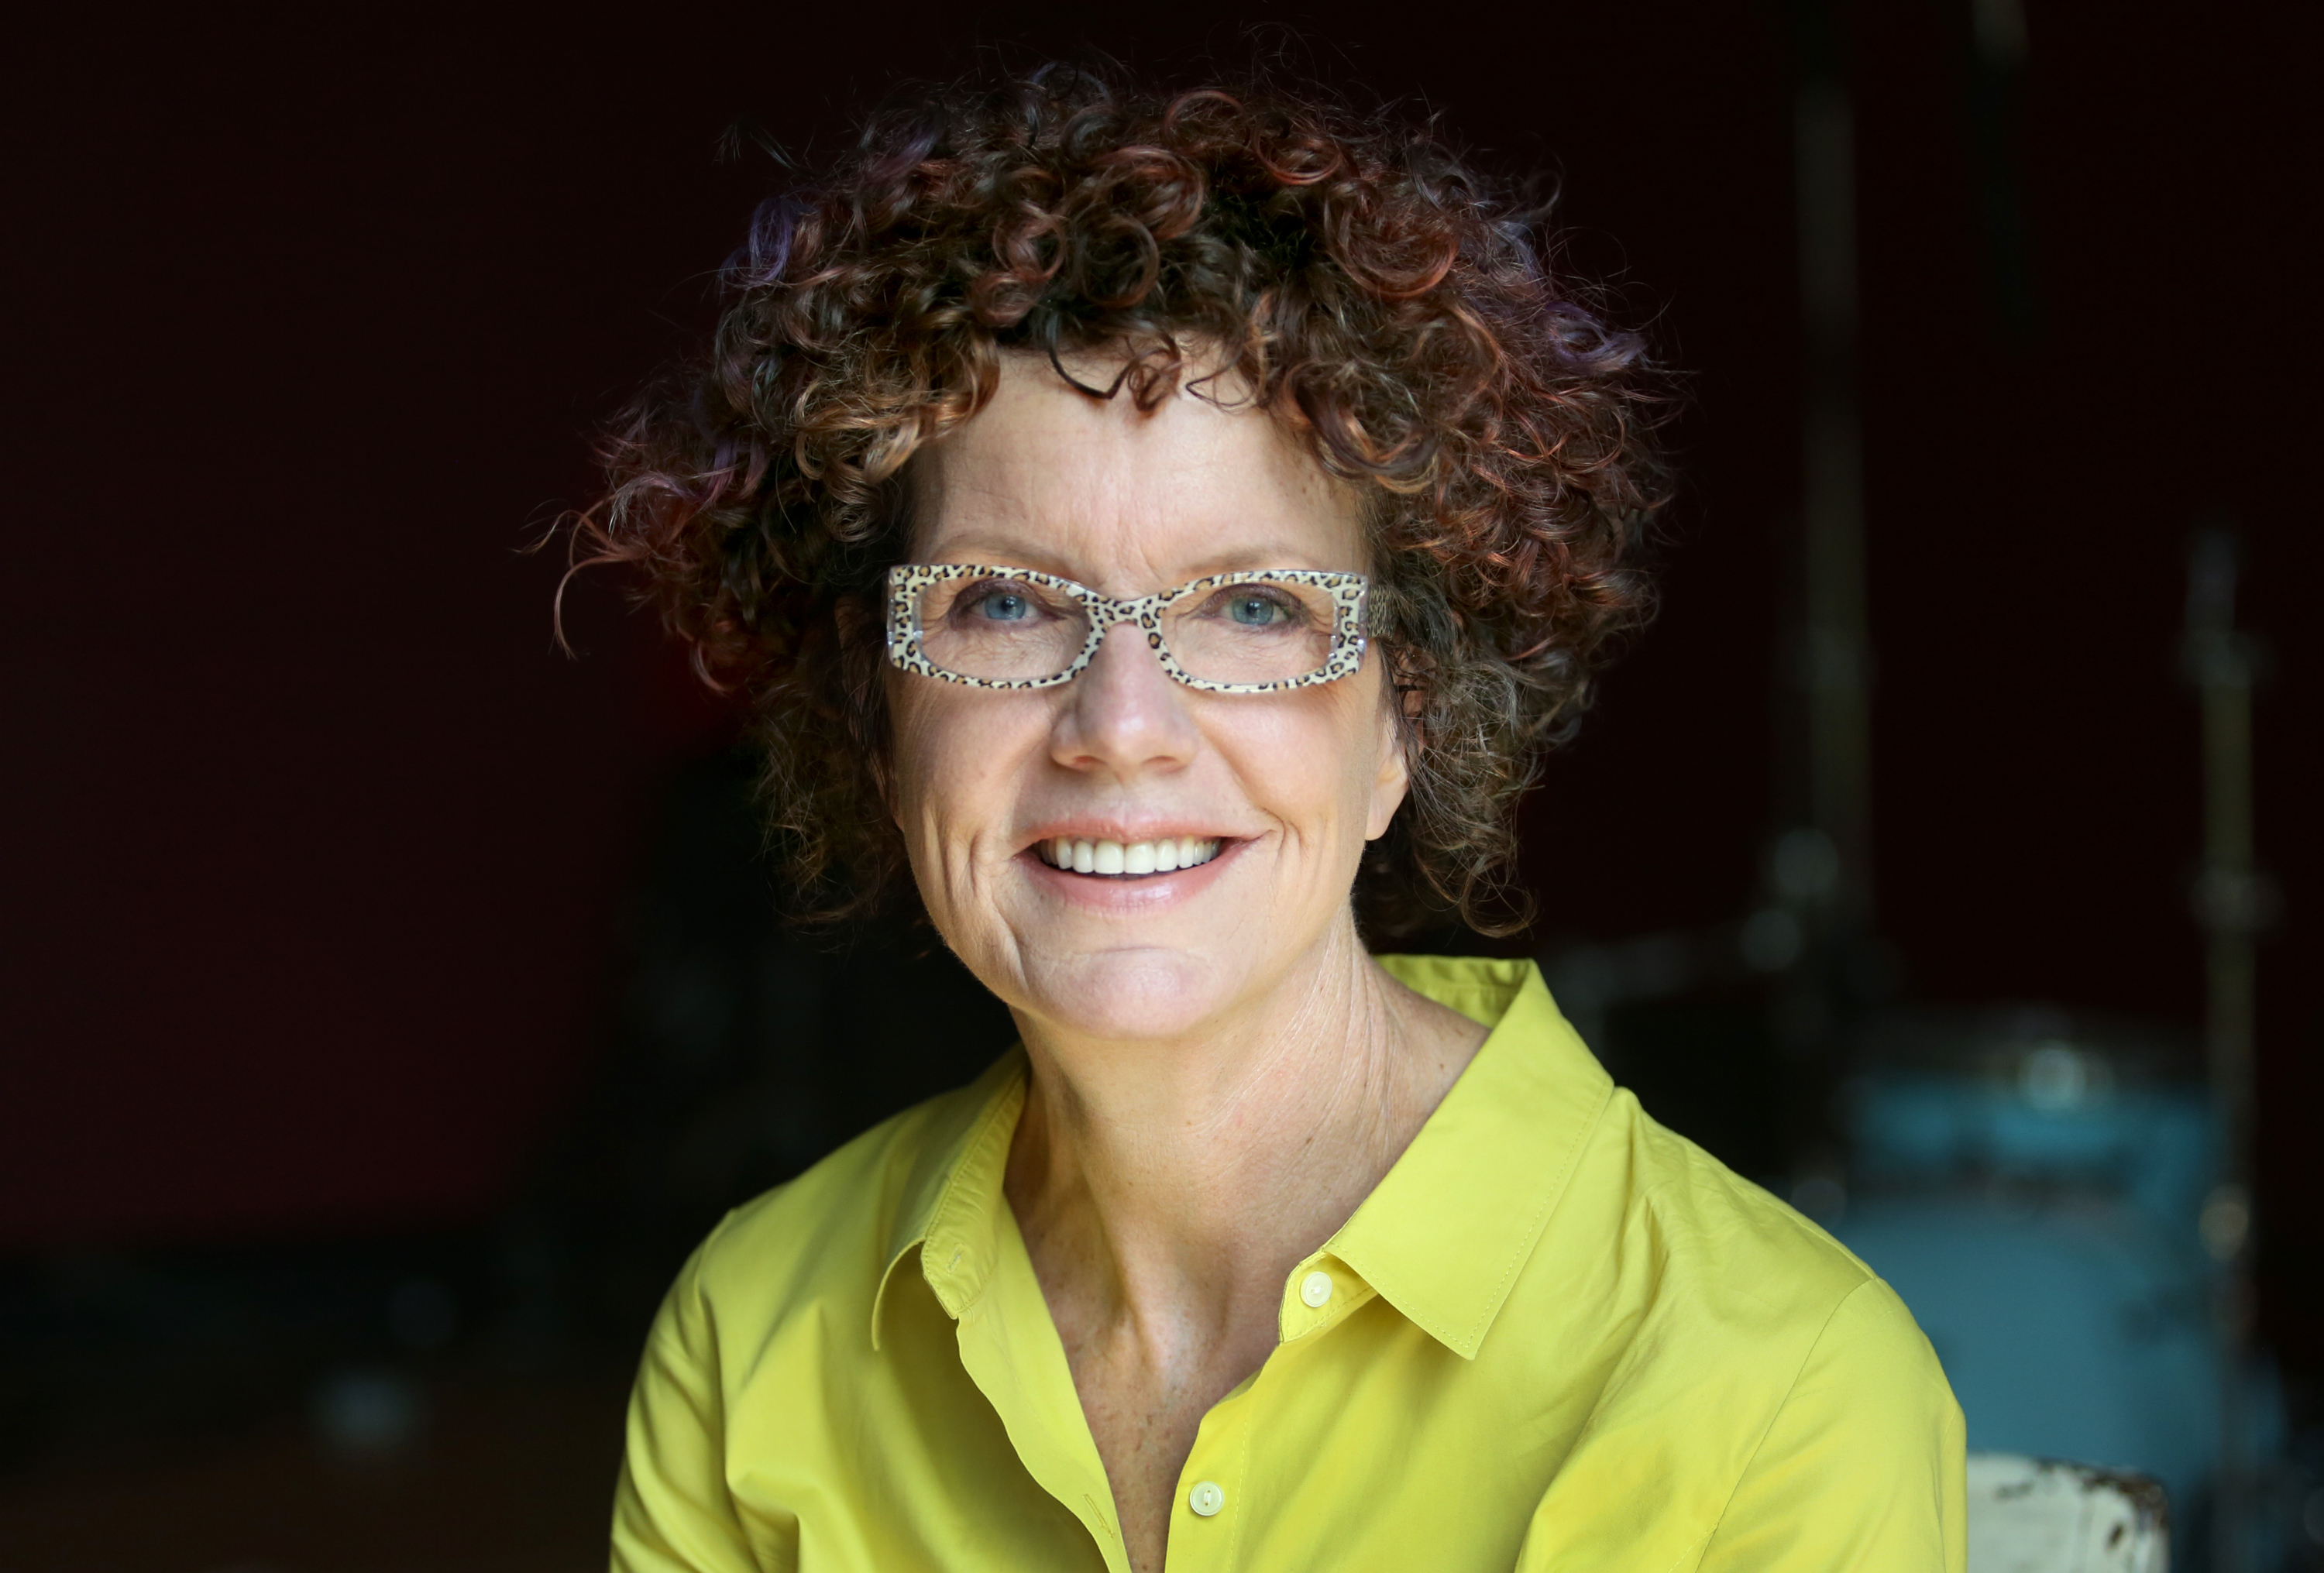
 Laurie Frick’s work treads the line between art and neuroscience. Frick uses self-tracking to map out everything in her life, which then gets transformed into beautiful 2D works and installations. Frick’s practice therefore is human existence in data form, made more tangible for the viewer.
What is self-tracking?
It’s about measuring something of yourself, the most interesting tracking comes from capturing something very familiar that you don’t notice. Such as how many times you wake up during the night, your minute-by-minute heart-rate or how many steps you take each day. What used to be something of an oddity, has now become so easy with iPhone apps and gadgets. Self-tracking has exploded into whole movement, called the Quantified-Self.
Your work draws inspiration from neuroscience and from your background in engineering and high-technology. What is it that makes the topics so interesting to you?
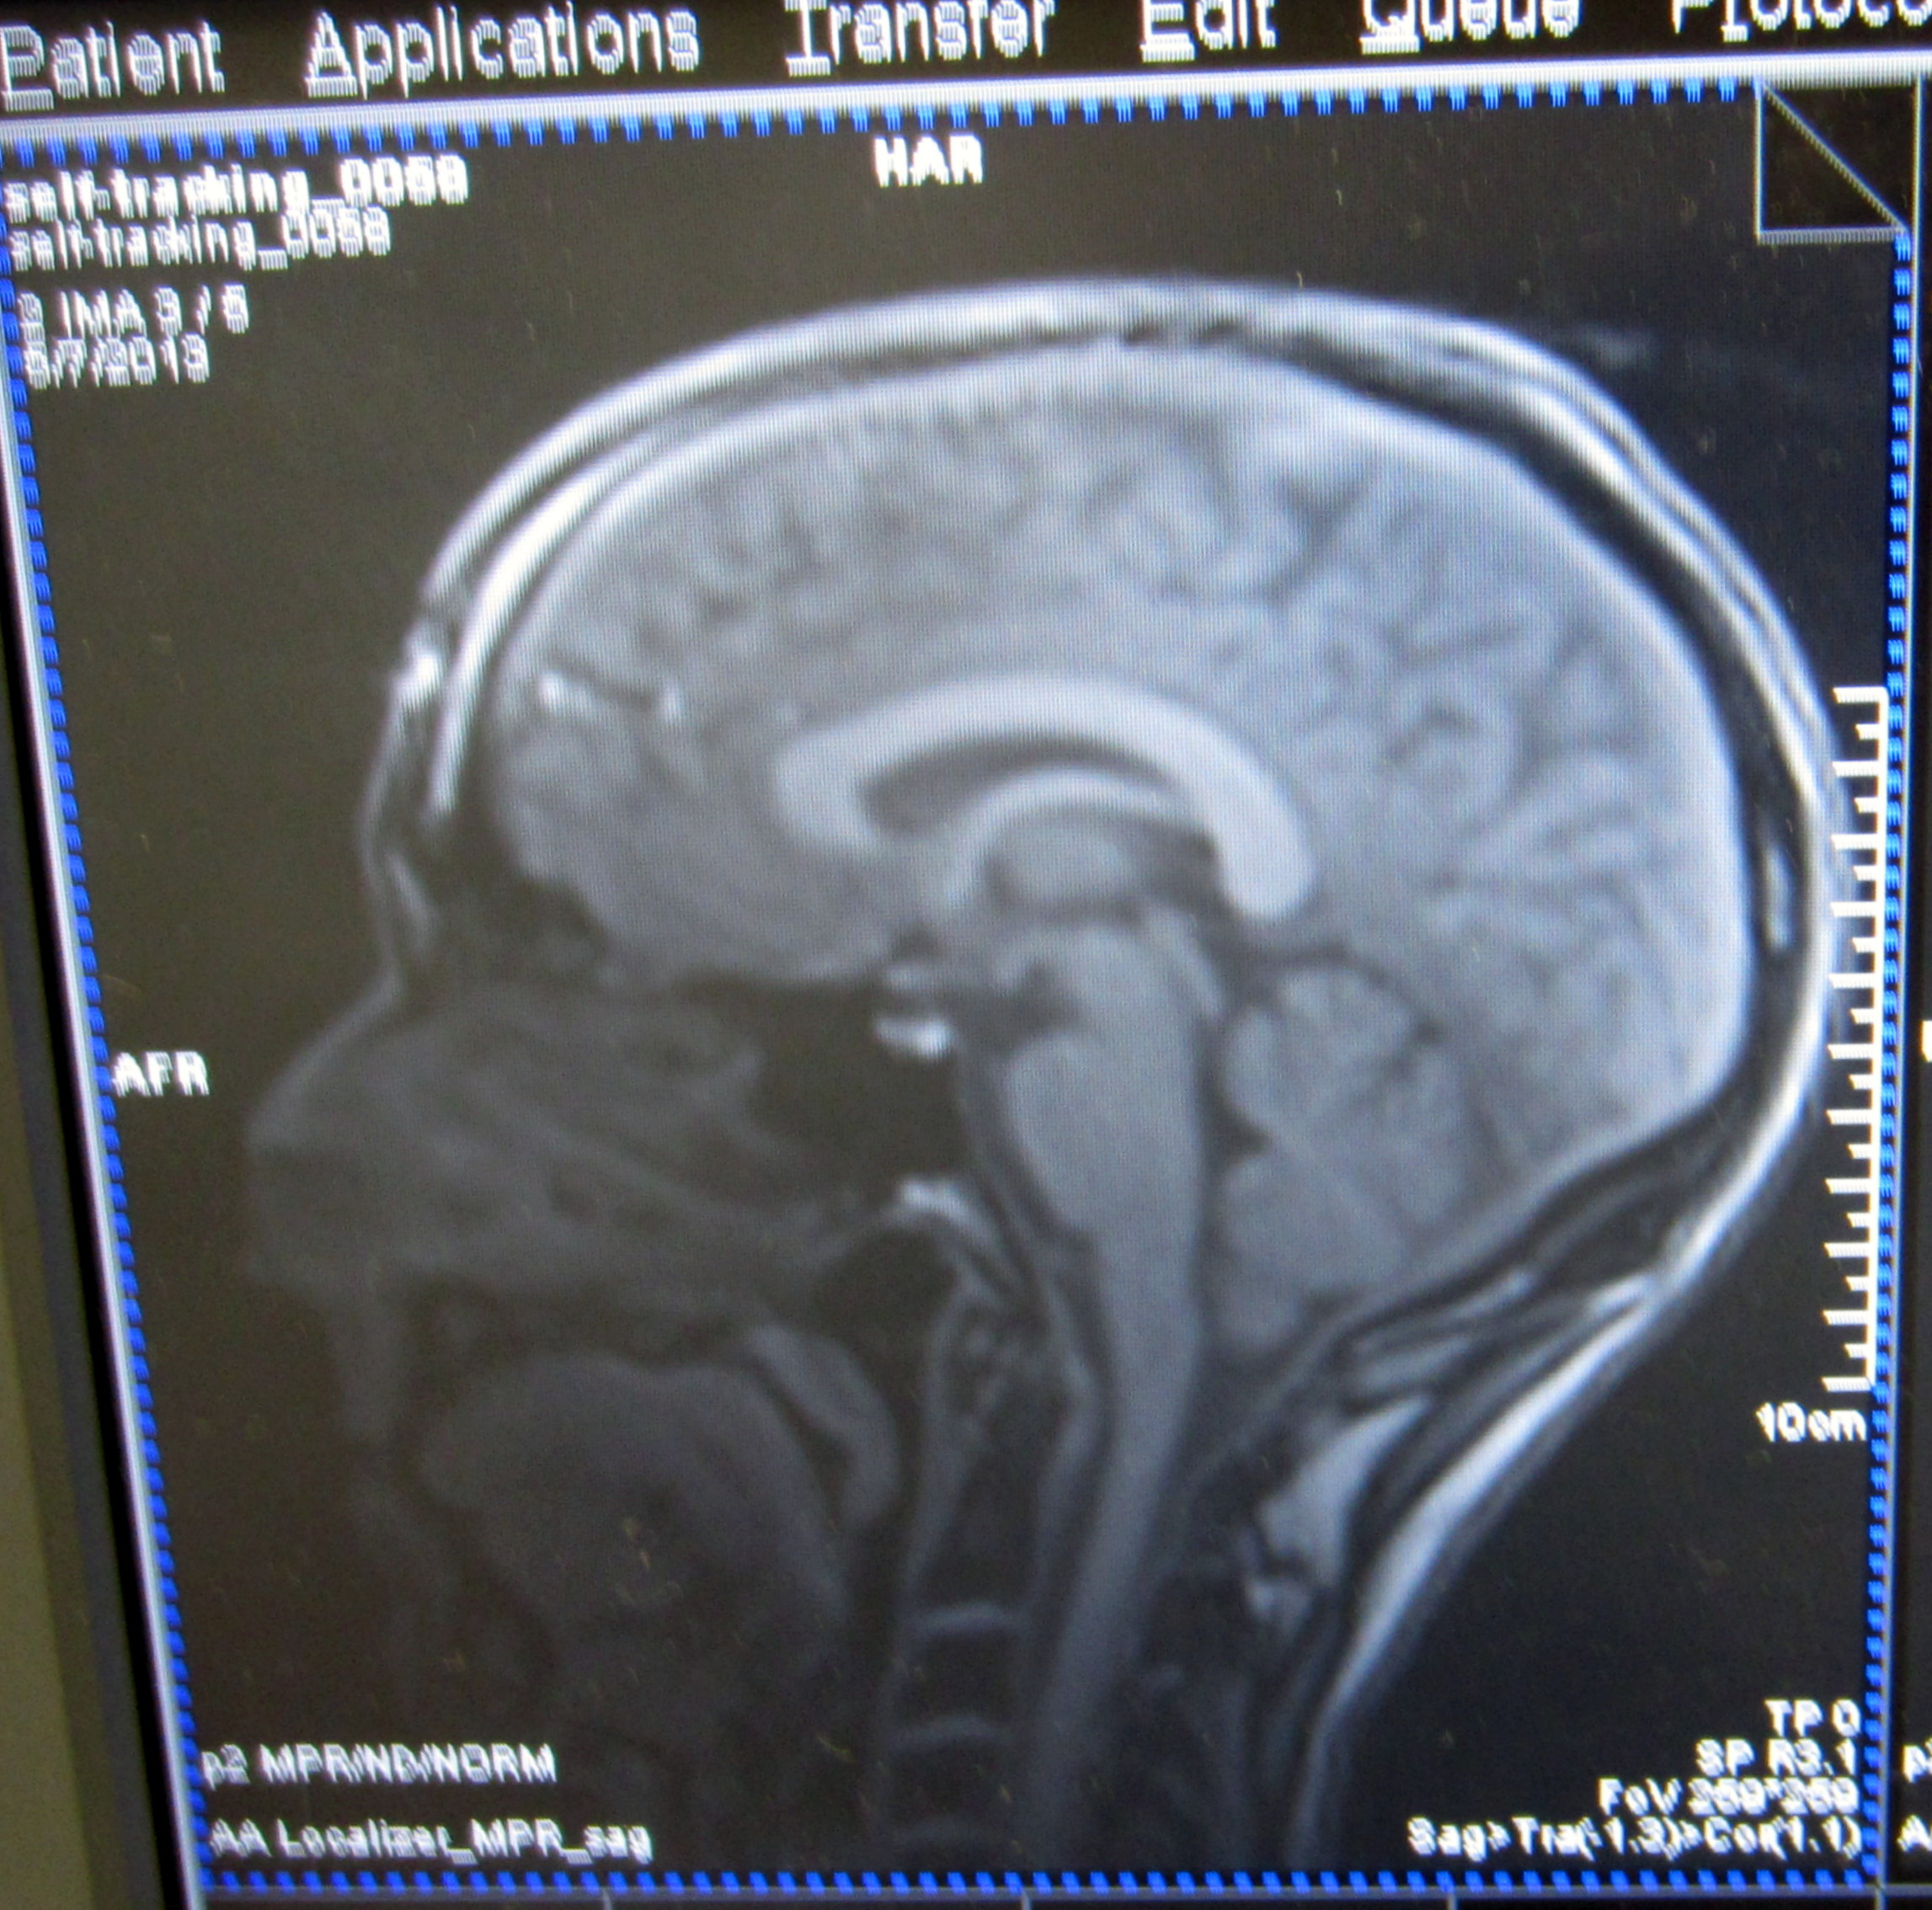
At this moment in time biotechnology and neuroscience are exploding, it’s where the biggest breakthroughs in science will come over the next decade. The moment that neuroscience was able to study live human brain activity using fMRI – what we call ‘brain scans’ the field of neuroscience research went into lightspeed. In my lifetime, we’ll begin to understand one of the last true mysteries on the planet – the human brain.
I’m halfway through my 2 year artist-in-residence program at the Poldrack Lab at UT. It’s the Neuroscience Research Center at the University of Texas, Austin, headed by Russ Poldrack, and filled with PhD’s. I get to hang out with them and let some of their smarts and research seep into my artwork.
What visual/aesthetic decisions go into transforming the information into art works?
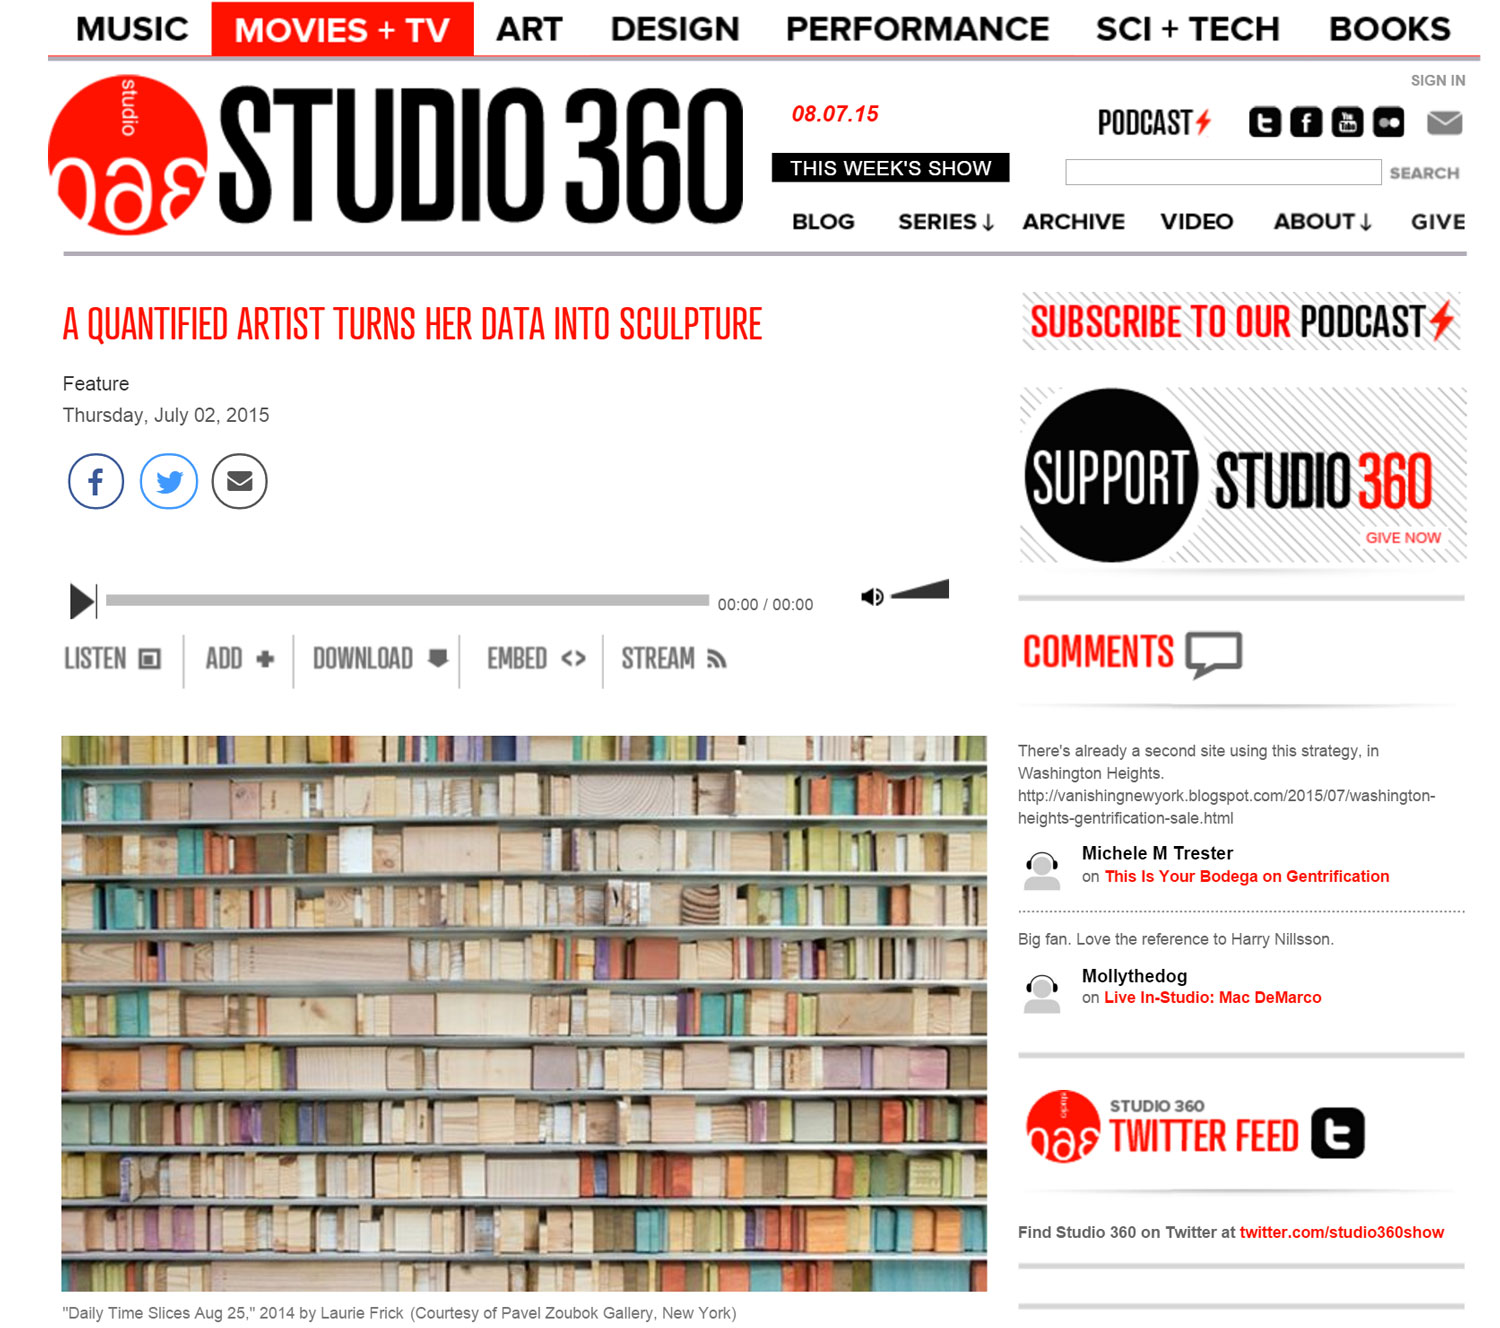
I have this idea that in the not-so-distant-future, data gathered about us will turn into physical patterns that we display as art. Human data portraits. These patterns are unique to us, and yet unconsciously recognizable as human… as us, familiar and reassuring. I try to look at the data and make a fifty-fifty decision about how to convey what is getting measured with what that data means, and the experience surrounding it. Almost a visual language for conveying human pattern.
Do you decide what data goes in which piece, is one piece made up by category e.g. heart rate, or is a piece made by the data in one day?
I think of the art and each piece I create as ‘experiments’ trying to see if I can make a visual representation of the measurements and help the patterns feel compelling and interesting. So far I’ve taken single measurements that I really understand and make installations and works from those. Combining measurements to see correlation between them, such as did the amount of walking affect sleep or weight is much, much harder. But, measurements over time are always a consideration. I like to work in chunks of time of a day or a month, it’s similar to how we normally see ourselves.
Where would you consider your work to sit in relation to both art and neuroscience? It’s squarely in the art-world, but I have this fantasy about artists seeing something of the future and eventually it turns out to be proven science. I hope that before I die, neuroscience and projects like the Human-Connectome which is mapping the human brain will find patterns or rhythms of the self that can be reflected in the visual world.
What visual/aesthetic decisions go into transforming the information into art works?
I have this idea that in the not-so-distant-future, data gathered about us will turn into physical patterns that we display as art. Human data portraits. These patterns are unique to us, and yet unconsciously recognizable as human… as us, familiar and reassuring. I try to look at the data and make a fifty-fifty decision about how to convey what is getting measured with what that data means, and the experience surrounding it. Almost a visual language for conveying human pattern.
Do you decide what data goes in which piece, is one piece made up by category e.g. heart rate, or is a piece made by the data in one day?
I think of the art and each piece I create as ‘experiments’ trying to see if I can make a visual representation of the measurements and help the patterns feel compelling and interesting. So far I’ve taken single measurements that I really understand and make installations and works from those. Combining measurements to see correlation between them, such as did the amount of walking affect sleep or weight is much, much harder. But, measurements over time are always a consideration. I like to work in chunks of time of a day or a month, it’s similar to how we normally see ourselves.
Where would you consider your work to sit in relation to both art and neuroscience?
It’s squarely in the art-world, but I have this fantasy about artists seeing something of the future and eventually it turns out to be proven science. I hope that before I die, neuroscience and projects like the Human-Connectome which is mapping the human brain will find patterns or rhythms of the self that can be reflected in the visual world.